Satellite / Places of change
Places of change
6 places where the years since 2018 are plain from orbit, each a Sentinel-2 picture a year and one number: how much of the picture is new since 2018 and 2019. Switch on "Show what's new" to see which part.
Grand Ethiopian Renaissance Dam: 23% of the picture is new since 2018
Benishangul-Gumuz, Ethiopia · 30 by 30 km
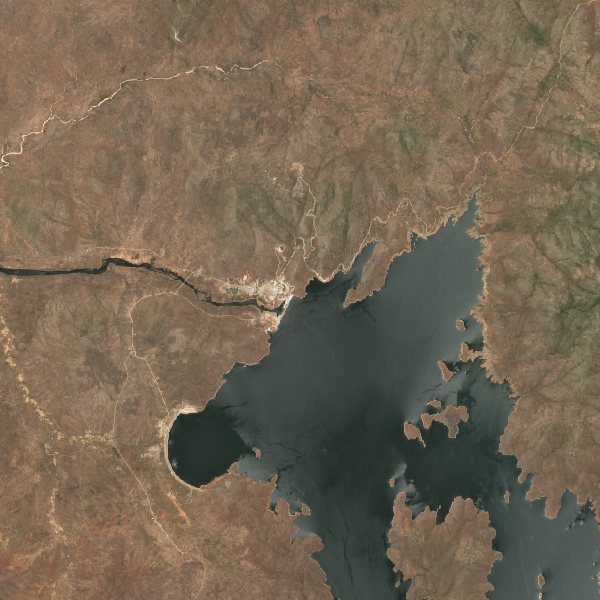
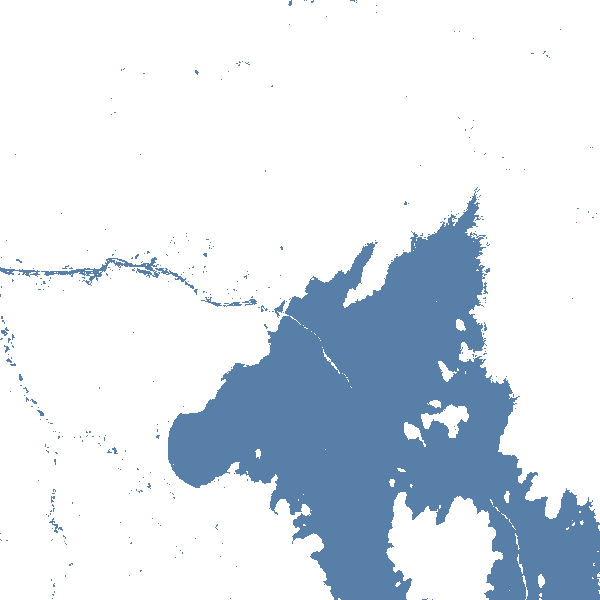
April 30, 2026: 22.9% of the picture new since 2018 and 2019. Contains modified Copernicus Sentinel data 2026.
Africa's largest hydropower dam, on the Blue Nile near the border with Sudan. Its reservoir began filling in July 2020; the pictures are from the dry season, when it is lowest.
23% new since 2018
The biggest single-year jump came by 2021: 9 points.
- The latest clear day each year between Jan 1 and Apr 30
New Administrative Capital: 7% of the picture is new since 2018
east of Cairo, Egypt · 14 by 14 km
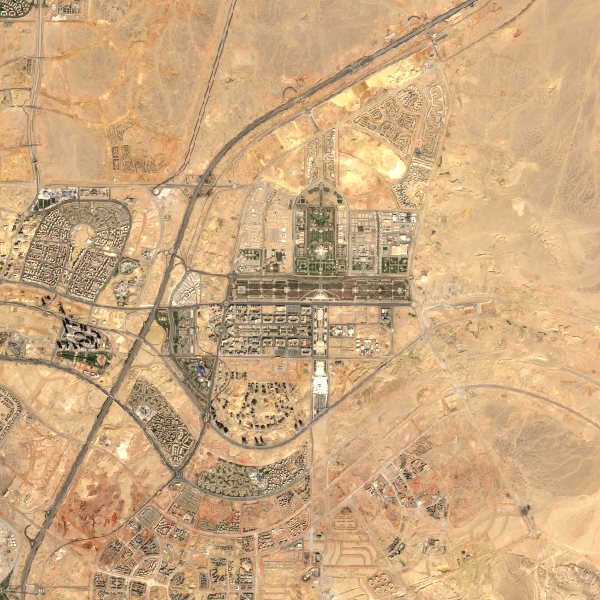
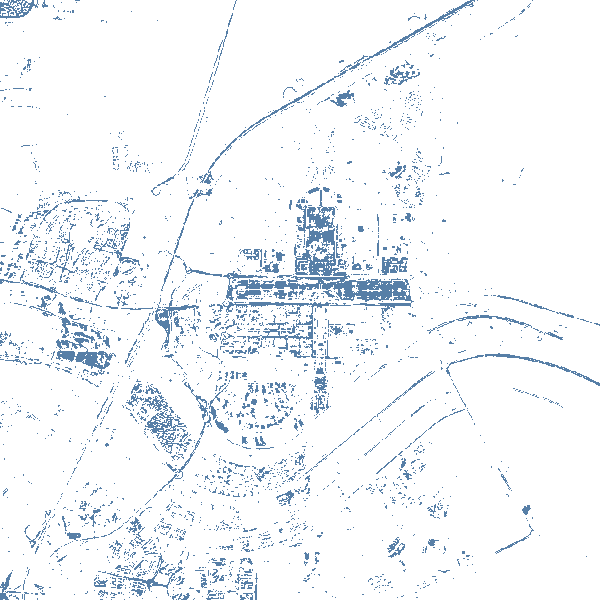
October 19, 2026: 7.4% of the picture new since 2018 and 2019. Contains modified Copernicus Sentinel data 2026.
Egypt's new capital, built on open desert about 45 km east of Cairo. The government began moving its ministries there in 2023.
7% new since 2018
The biggest single-year jump came by 2021: 4 points.
- The latest clear day each year between Jan 1 and Oct 28
Stargate, Abilene: 12% of the picture is new since 2018
Taylor County, Texas · 6 by 6 km
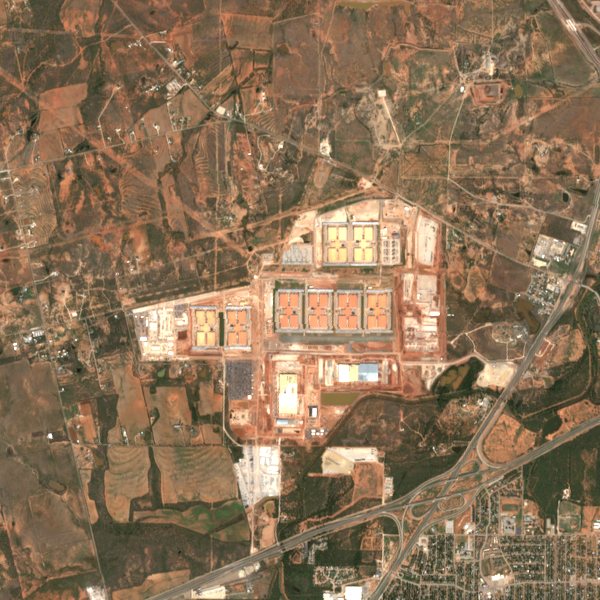
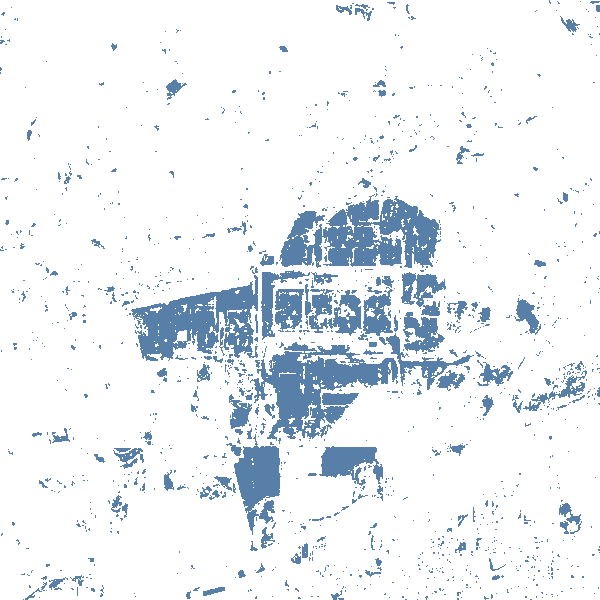
October 23, 2026: 11.9% of the picture new since 2018 and 2019. Contains modified Copernicus Sentinel data 2026.
The first campus of the Stargate AI project, built from 2024 on ranch land north of Abilene.
12% new since 2018
The biggest single-year jump came by 2025: 5 points.
- The latest clear day each year between Jun 1 and Oct 28
TSMC Arizona: 5% of the picture is new since 2018
north Phoenix, Maricopa County, Arizona · 6 by 6 km
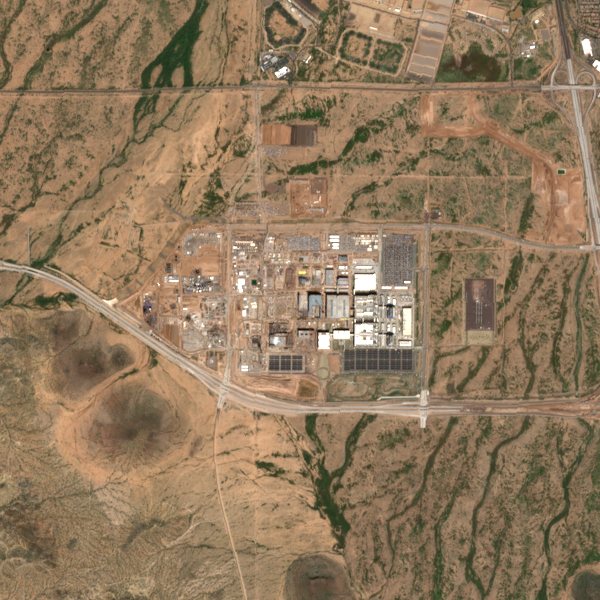
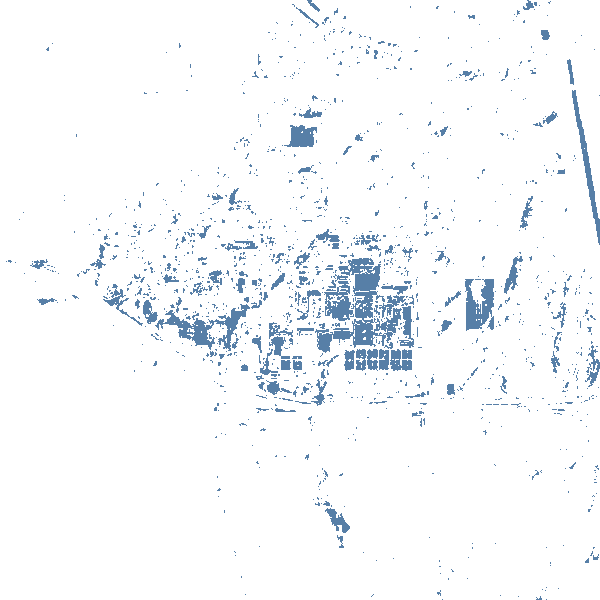
October 23, 2026: 5.4% of the picture new since 2018 and 2019. Contains modified Copernicus Sentinel data 2026.
Taiwan Semiconductor's first American chip plants, on desert bought in December 2020 near Interstate 17 and Loop 303.
5% new since 2018
The biggest single-year jump came by 2021: 3 points.
- The latest clear day each year between Apr 1 and Oct 28
Data center alley: 8% of the picture is new since 2018
Ashburn, Loudoun County, Virginia · 9 by 9 km
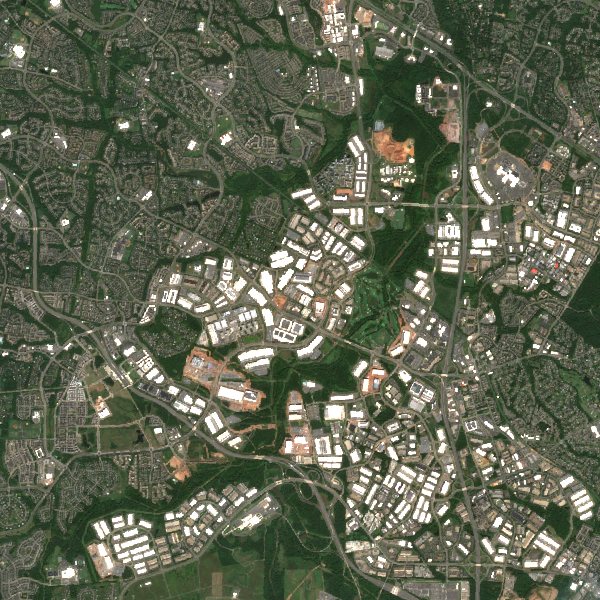
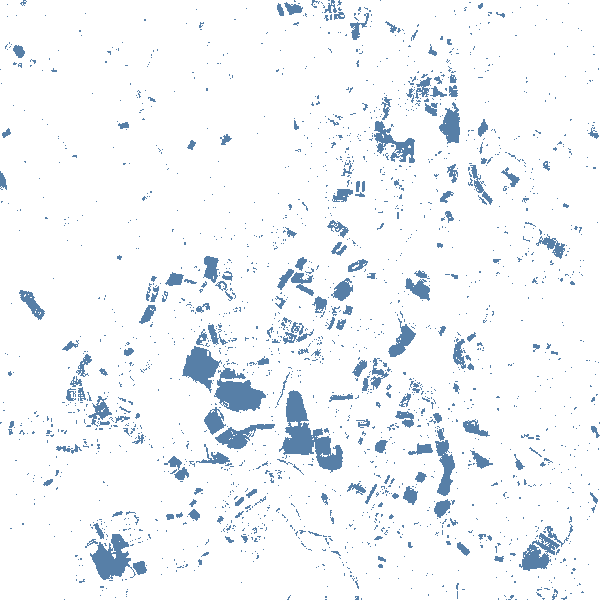
September 16, 2026: 7.8% of the picture new since 2018 and 2019. Contains modified Copernicus Sentinel data 2026.
Northern Virginia is the largest data center market in the world by most industry counts; its white roofs fill the fields and woods between the subdivisions.
8% new since 2018
The biggest single-year jump came by 2022: 4 points.
- The latest clear day each year between Jun 1 and Sep 30
Lahaina: 18% of the picture is new since 2018
Maui County, Hawaii · 4 by 4 km
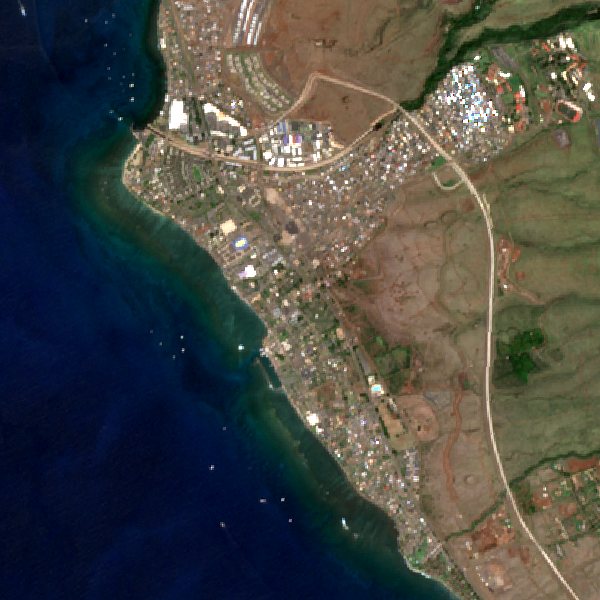
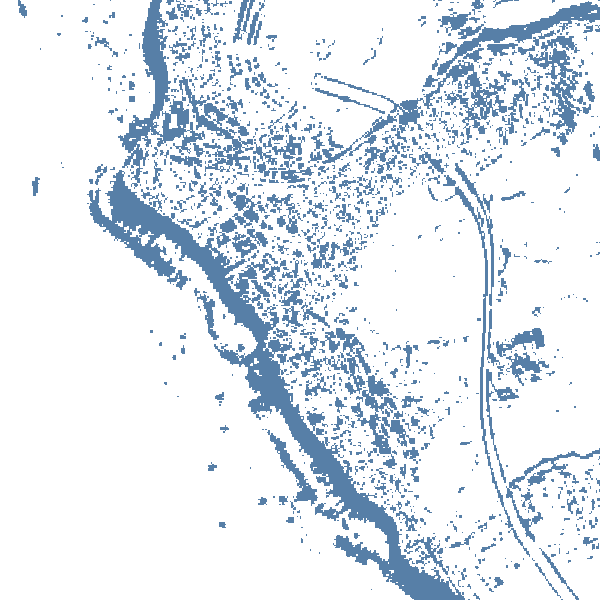
October 21, 2026: 17.7% of the picture new since 2018 and 2019. Contains modified Copernicus Sentinel data 2026.
The town burned on 8 August 2023, the deadliest US wildfire in more than a century. The pictures follow it before, after and through the rebuilding.
18% new since 2018
The biggest single-year jump came by 2026: 11 points.
- The latest clear day each year between Aug 15 and Dec 31
How "new" is measured. Each year's picture is the latest clear Sentinel-2 day in the same season, read in five bands (blue, green, red, near-infrared and short-wave infrared). Each picture is first scaled, band by band, to its own median, so a hazier, wetter or differently lit year doesn't count as change. A pixel is new when it differs by about half or more, on average across the five bands, from both the 2018 and the 2019pictures, so one odd early year can't inflate every year after it. Read the number as "how much of this picture is new", not as built area: leaves and crops still move it a little. More on Sources.